


Introduction
Contents
- Introduction
- Editor’s Choice
- General Google My Business Statistics
- Google My Business Statistics By Consumer Behaviour
- By Actions Taken
- By Reviews Written Per Location
- By Profile Verification
- By Verification Rate
- By Google Messages Usage
- By Industry
- By Website Visit
- Search Views For Business Profile
- By Google Reviews
- By Potential for Growth
- Conclusion
Google My Business Statistics: In today’s digital age, having an online presence is critical for businesses to establish credibility and attract customers. Studies reveal that consumers increasingly rely on the internet for everything, from ordering food to finding professional services, and lacking an online footprint may raise skepticism about a company.
Google My Business (GMB) is a key platform that helps businesses strengthen their online presence by providing critical information such as business categories, locations, product offerings, customer reviews, photos, and videos. GMB also verifies businesses, ensuring trustworthiness.
Recent data highlights the importance of optimizing GMB listings for local search visibility. “Near Me” search queries have surged by over 200%, making local SEO essential. Furthermore, 72% of local searchers visit a business within five miles of their location, indicating the impact of proximity on consumer behavior.
Additionally, it is reported that local businesses receive 94% of their GMB-related calls on weekdays, reinforcing the importance of having updated and optimized GMB profiles. With 97% of consumers learning about local businesses online, having a well-maintained Google Business Profile is key to local search success.
Editor’s Choice
- Verified Google business profiles generate around 10 interactions per view, helping businesses engage with customers more.
- “Near me” or “within my area” searches make up 84% of discovery searches, showing how popular local searches are on Google.
- A complete Google business listing, with details like category, images, videos, website link, and contact information, is 7 times more likely to receive clicks.
- 90% of internet searches are done on Google, making it essential for businesses to have a listing to build a strong brand.
- Businesses with verified Google profiles typically have 26 photos, boosting their visibility.
- Verified businesses receive about 66 requests for directions each month, with hospitality and recreation businesses getting the most.
- Only 44% of local businesses are listed on Google, which limits their visibility to potential customers.
- On average, a business listed on Google gets 59 actions per month, like calls, clicks, and conversations.
- Hotels upload an average of 150 photos to their Google business profiles, making them stand out to potential guests.
- “Near me” searches have increased by over 200%, highlighting the growing importance of local searches.
- More than half of interactions on Google business profiles lead to website visits.
- 97% of users primarily learn about local businesses online, underlining the importance of a strong online presence.
- 64% of consumers have used Google business profiles to find contact details, making accurate listings crucial for communication.
- In 2020, there was a 61% increase in calls from Google business profiles, reflecting the growing role of online listings.
You May Also Like To Read
- Google Pixel Smartphones Statistics
- Google Stadia Statistics
- Google Home Smart Device Statistics
- Google Search Statistics
- Google Statistics
- Google Smartphone Statistics
- Google Lens For iPhone
- Alexa vs Google Home vs Siri
- Popular Google Doodle Games
- Google My Business Statistics
- Google Shopping Statistics
- Google Revenue Statistics
- Google Chrome Statistics
General Google My Business Statistics
- Google dominates 90% of global internet searches, making a Google business listing essential for building a strong brand image.
- Complete Google business profiles, which include key details like contact information, business hours, images, and more, are 7 times more likely to attract clicks compared to incomplete listings.
- “Near me” or “within my area” searches make up 84% of discovery searches on Google, showing the importance of local visibility.
- Half of the businesses listed on Google lead users directly to their website, increasing potential customer engagement.
- 50% of pay-per-click ads are viewed on mobile devices, highlighting the growing importance of mobile optimization.
- On average, a business listed on Google receives 33 clicks per month.
- Most businesses—17.2% on Tuesdays and 17% on Wednesdays—are added to Google during weekdays, with Sunday seeing only 10.3%.
- A striking 94% of calls generated from Google Business listings occur on weekdays, showing when customers are most engaged.
- Around 16% of businesses generate over 100 calls each month from their Google business profile.
- Businesses typically upload at least 11 photos, with hotels uploading an average of 150 images, greatly enhancing visibility.
- Of all user actions on Google Business profiles, 56% are directed to website visits.
- A typical business listing generates an average of 59 actions per month, which includes calls, clicks, and online conversations.
- Globally, only 44% of local businesses have claimed their Google business listing, missing out on potential customer interaction.
- An impressive 90% of users trust businesses that are listed on Google, establishing the platform as a credibility booster.
- Verified business profiles on Google receive an average of 1,803 views per month, showcasing their reach and visibility.
- Adding photos to a Google business listing can double its perceived trustworthiness.
- Around 40% of businesses globally have not yet posted content on Google’s My Business platform.
- Listings with photos generate 17% more revenue per visitor, emphasizing the power of visuals.
- As of 2023, the average Google business profile receives 66 reviews per location.
- Roughly 60% of businesses post on social media through their Google business profiles, helping to engage audiences.
- Nearly 51% of businesses have unclaimed Google profiles, meaning they lack essential information like contact details and ownership.
- Google currently offers over 4,000 business categories for profiles, offering wide-ranging options for business types.
- Negative reviews are 45 times more likely to deter potential customers from contacting a business.
- Businesses with complete listings are more likely to show up in search results and get 7 times more clicks.
- Approximately 72% of local searchers visit businesses within a five-mile radius.
- Local businesses receive 94% of their calls on weekdays through their Google business profile.
- More than 5% of Google Business Profile views convert into actual customer actions, and this rate is increasing.
- A business listed on Google generates about 10 interactions for every verified profile view.
- Businesses in retail, automotive, and hospitality industries lead in terms of Google search views.
- 42% of local searches result in clicks on Google’s local pack, helping businesses capture nearby customers.
- 90% of searchers read reviews before making a purchase, highlighting the importance of managing online feedback.
- 40% of businesses receive over 1,000 views per month, showing the extensive reach of verified profiles.
- Listings with reviews generate more customer trust, with the average profile having 39 reviews.
- A timely response to reviews is important, as 20% of consumers expect businesses to reply quickly.
Google My Business Statistics By Consumer Behaviour
- The majority of the consumers prefer to visit businesses that are near their location.
- Furthermore, Google My Business Statistics show that 98% of consumers when looking at a brand on the platform give importance to reviews.
- 42% of people are likely to ask for directions to the store using Google Maps.
- 70% of consumers are likely to visit a store after seeing the ad on Google.
- 64% of consumers look for business contact details for local businesses.
- 74% of consumers said businesses with reviews are more trustworthy.
- 93% of consumers go to Google Maps to search for the business.
- Furthermore, 91% of consumers read business reviews before contacting them.
- 59% of people prefer to check images on Google My Business before proceeding with purchase.
- 87% of people search for a local business every day on Google.
- Moreover, 72% of consumers prefer those businesses that are comparatively closer to their locations.
- 65% of consumers are only likely to give a Google My Business Review if they have a positive experience with the brand.
- Furthermore, 68% of consumers will give a review on business when asked.
- 42% of those who have given a business review expect a response within 60 minutes or less.
- On the other hand, 67% expect a response on weekends or nights.
- Since COVID-19, “near me” searches increased by 900%.
- 72% of consumers are likely to contact businesses located within 5 miles.
- 87% of consumers go to Google to assess the business.
- Furthermore, 88% of shoppers are likely to shop with the business, if they see that the owner of the business is responding to the reviews irrespective of negative or positive.
- 79% of people are likely or highly likely to provide a review if the business has given them a positive experience changed from a negative one.
- 63% of written review consumers said the brand never responded to their review.
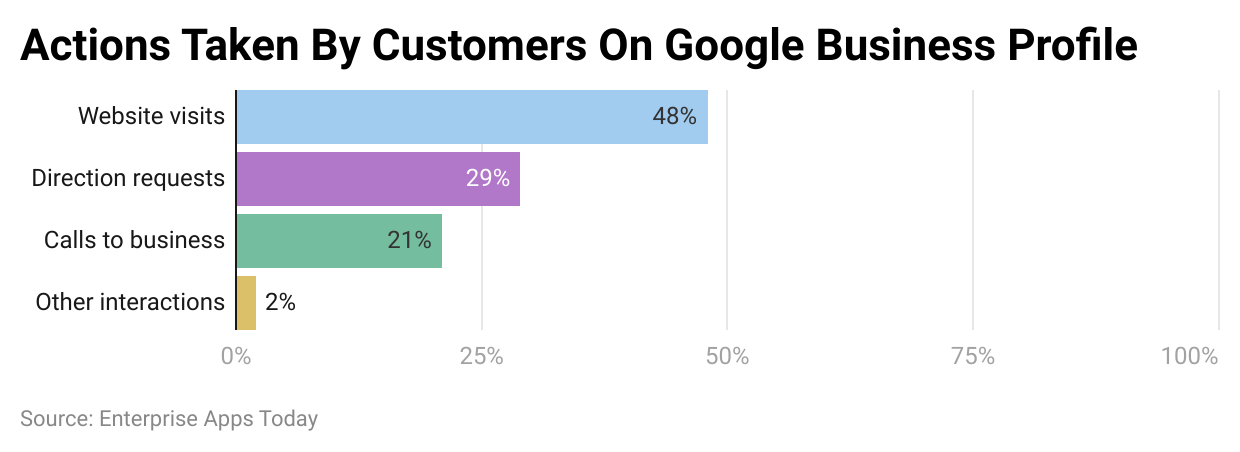
By Actions Taken
 (Reference: birdeye.com)
- 48% of users who find a business through a Google search visit the brand’s website.
- 29% of people request directions to the store.
- 21% of users make phone calls to the business.
- 2% engage in other types of interactions.
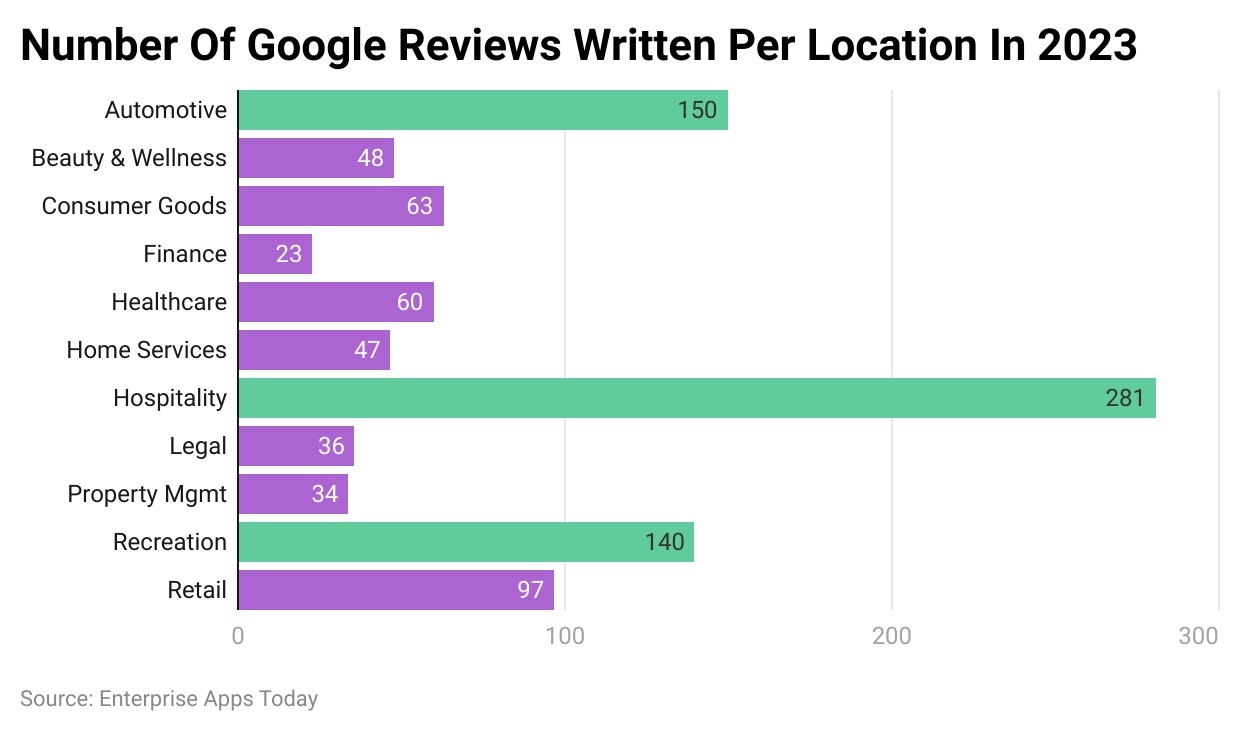
By Reviews Written Per Location
 (Reference: birdeye.com)
- Automotive businesses get around 150 reviews per location on Google.
- Hospitality businesses receive about 281 reviews per location.
- Recreation businesses gather around 140 reviews per location.
- Finance businesses tend to have fewer reviews per location.
- Legal businesses also get fewer reviews per location.
- Property management businesses generate a low number of reviews per location.
You May Also Like To Read
- Google Revenue Statistics
- Microsoft Teams Statistics
- Project Management Statistics
- Popular Google Doodle Games Statistics
- SaaS Statistics
- ChatGPT 4 Statistics
By Profile Verification
- 64% of businesses on Google have their profiles verified.
- More than half of the home services and contractor businesses listed on the platform are yet to be verified.
- On the other hand, businesses in hospitality, healthcare lead, and property management have the highest rate of verification.
- Businesses with verifications generate around 66 direction-to-the-place requests per month, in terms of which, hospitality and recreation businesses lead the percentage.
- Furthermore, verified businesses generate at least 595 calls which is 50 calls per month.
- Only 24% of businesses in the same category generate 50+ calls every month.
- Google My Business Statistics by verified profiles state that 26 is the average number of photos for verified business locations, in which, home service businesses have the highest number of average photos contributing 70, with the lowest for healthcare and finances resulting in 12 and 6 each.
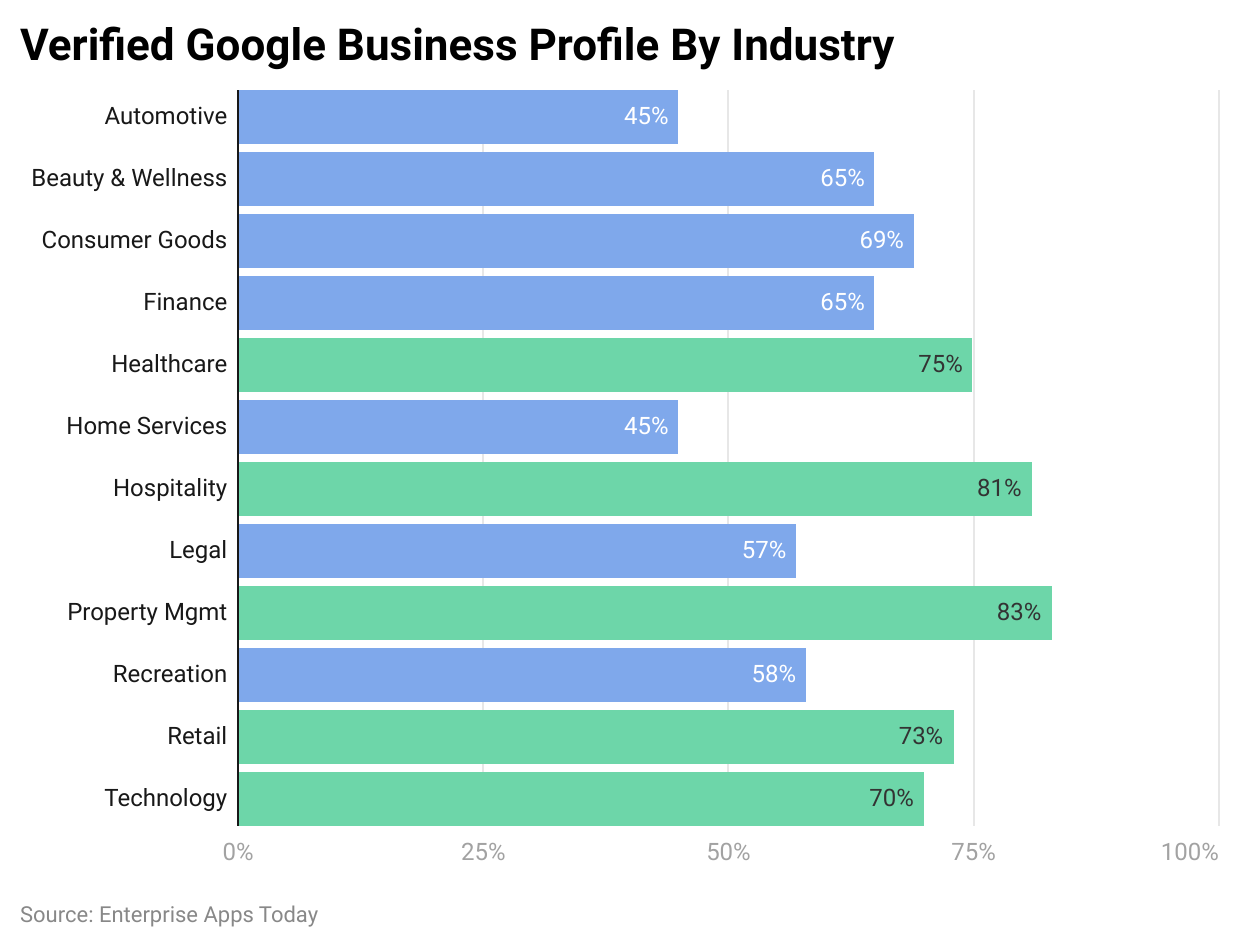
By Verification Rate
 (Reference: birdeye.com)
- Property management businesses have the highest rate of verified profiles at 83%.
- Healthcare businesses follow with 81% verified profiles.
- Retail businesses have 73% of their profiles verified.
- Legal services have a lower verification rate of 57%.
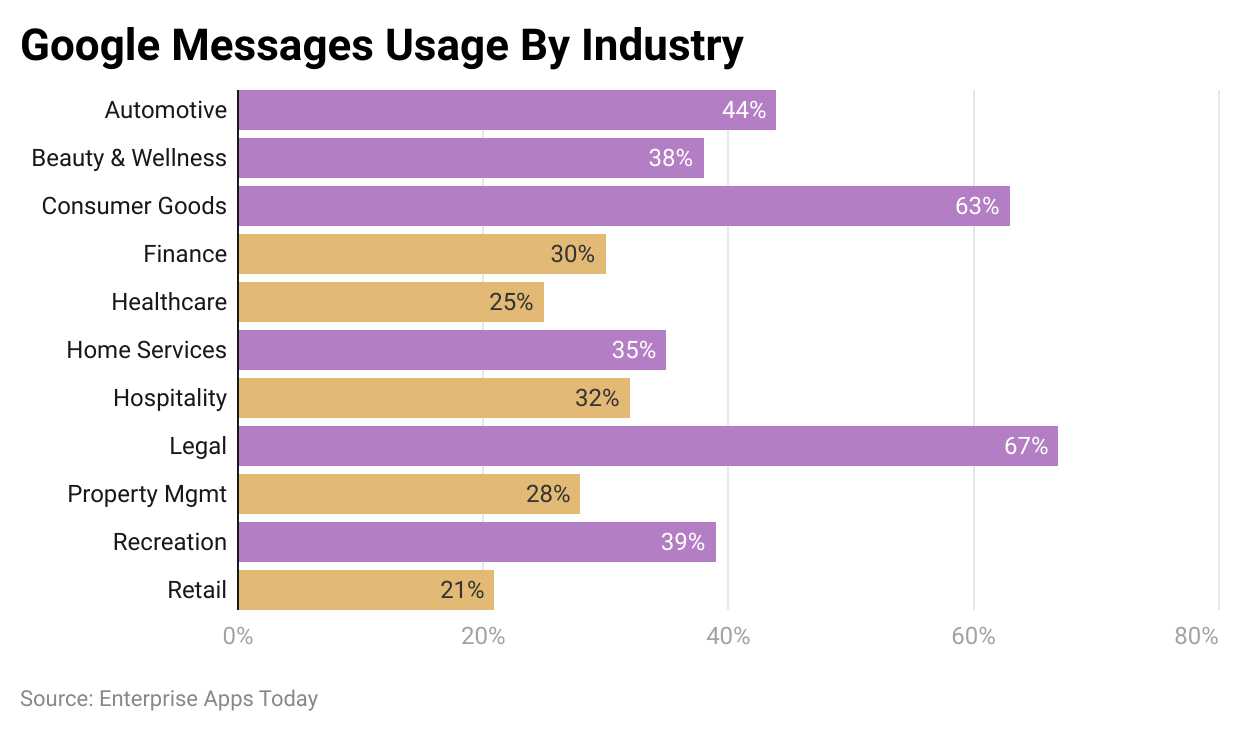
By Google Messages Usage
- Healthcare and retail businesses have usage rates of 21% and 25% respectively.
- Furthermore, the highest number of Google Messages usage rates by listed businesses is observed for automotive 44%, consumer goods, and services 63%, and legal businesses 67%.
- Google My Business Statistics show that only 33% of verified businesses use the mentioned messaging services.
By Industry
 (Reference: birdeye.com)
- Businesses in the legal industry use Google messages for communication the most, at 67%.
- The consumer goods industry also heavily relies on Google messages, with 63% usage.
- The automotive industry uses Google messages for communication in 44% of businesses.
- This shows that many businesses value direct messaging to engage with customers.
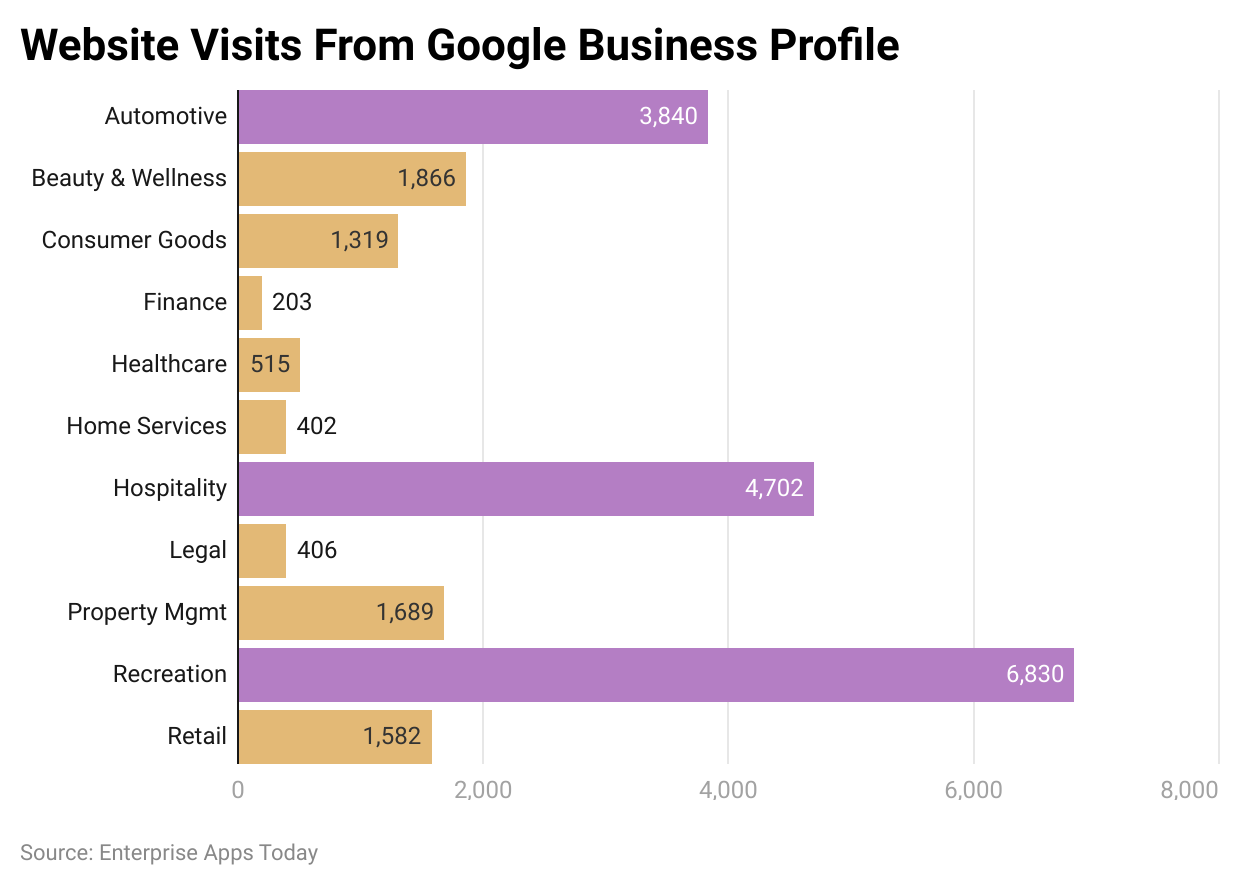
By Website Visit
 (Reference: birdeye.com)
- The hospitality industry gets the most website visits, with 4,702 visits from discovery searches.
- Recreation is also a top industry, with 6,830 website visits.
- The automotive industry follows closely, with 3,840 visits.
- Finance, healthcare, and home services see fewer website visits.
- These industries show lower website traffic from businesses listed on Google.
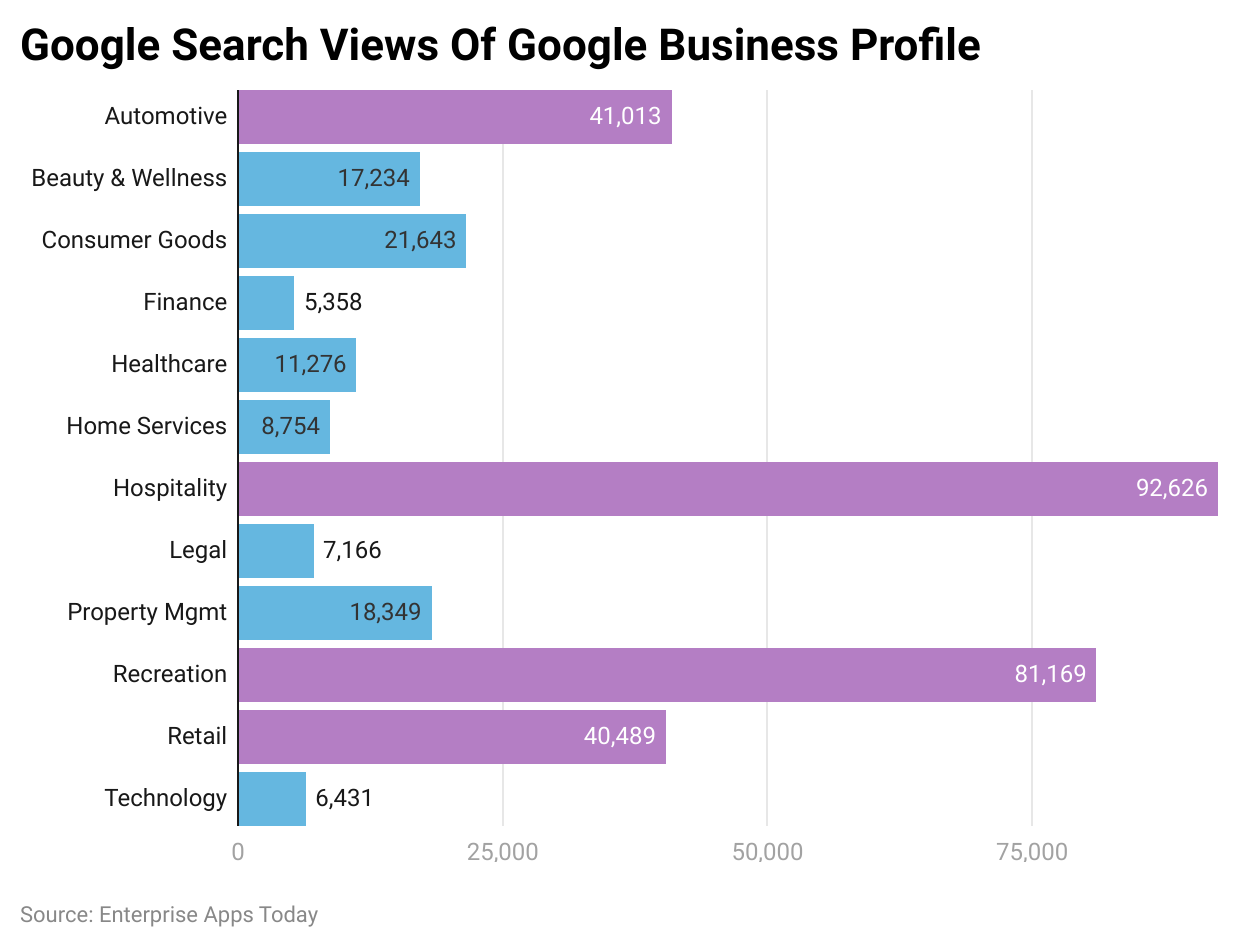
Search Views For Business Profile
 (Reference: birdeye.com)
- Hospitality services rank the highest, with an average of 92,626 views.
- Recreation businesses follow closely, with 81,169 views on average.
- Automotive businesses receive an average of 41,013 views.
By Google Reviews
- Google reviews play a big role in shaping a business’s online reputation and customer trust.
- Businesses got an average of 66 new Google reviews per location in 2023.

- The number of reviews shows how important customer feedback is for managing a business’s online reputation.
- The volume of reviews received can impact how customers view and trust a business.
- Positive reviews help businesses attract more customers and build trust faster.

Customers frequently used Google Business Profiles to find information, get directions, or contact businesses directly.
- Website visits made up 48% of all interactions on Google Business Profiles. This shows that most customers prefer to visit a company’s website after finding them on Google.
- Direction requests accounted for 29% of interactions, indicating many customers want to visit the physical store or location.
- 21% of interactions were phone calls, meaning a good number of customers choose to contact businesses directly after finding them on Google.
By Potential for Growth
- 60% of businesses have posted content on their Google Business Profiles, showing that a majority are using this tool for customer engagement.
- 40% of businesses have not posted anything, indicating a large portion are missing out on this feature.

- Home Services businesses have the highest number of photos, with an average of 70 per profile, showcasing their services visually.
- Automotive businesses follow, averaging 57 photos, emphasizing their products through visuals.
- Beauty & Wellness businesses typically have 44 photos, likely highlighting services and products.
- Technology businesses post about 19 photos, showing moderate use of visual content.
- Healthcare businesses use an average of 12 photos, suggesting room for more visual engagement.
- Finance businesses use the least visual content, with only six photos per profile, indicating minimal use of photos.
- This varied use of photos across industries shows that many businesses can improve their online presence by using more visual content.
Conclusion
Google My Business is a platform that allows small-scale to large-scale businesses to have their existence over the Internet. The platform is owned by Google and free to use. As we all know, Google is the default search engine for the majority of the systems, thus businesses listed on this platform benefit.
Google My Business Statistics proves this is a dominating player in the market and one of the best tools to list the business online. Not just businesses, but freelancers can also list their businesses online for wider reach in the local market. There is no doubt that Google is one of the best companies that provides everything a company needs to run the business.